Whereas the total quantity of water on this planet is more or less fixed, its quality is deteriorating, because we have been contaminating it for thousands of years, with little concern for the consequences.
Drinking water regulations continue to increase water quality standards, and industrial and commercial activities are requiring higher quality water in many applications. Due to population growth, drinking water and agricultural quantity demands are also steadily increasing.
Industries, in general, are very poor stewards of water conservation. Most water brought into the plant is used only once, even though that use may have had very little impact on water quality.
In most of the industrialized world, we have labored under the misconception that our water supply was inexhaustible as well as inexpensive. This cost aspect has been exacerbated by the fact that, in many areas, the price of water has been partially subsidized by local government.
Regarding the world’s supply of fresh water, if all the world’s water were to completely fill a one gallon jug, the fresh water available for use would amount to only about one tablespoon. Another analogy is illustrated in Figure 1.
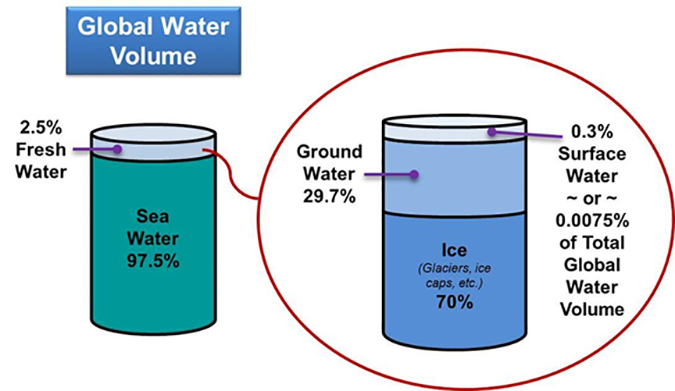
Today, about 20% of the world’s population is without clean water, and it is expected that, without drastic measures, half of the people on this planet will suffer from severe water shortages by 2050. The U.N. estimates that over 10 million people a year die from drinking polluted water, mostly children.
Across the United States, 39% of water use goes to energy production. Farms use another 40%, and manufacturing an additional 11%. Together, these three sectors use about 300 billion gallons of fresh water every day.
As citizens of the largest “water-wasting” country in the world, each American uses, on average, 100 gallons of water a day, easily twice that of the average European.
Following are some examples of the volume of water required to manufacture items we use everyday.
-
Item Gallons of Water
Cotton shirt 2840
Pair of jeans 2100
Tee shirt 660
Pair of shoes 3625
Cell phone 3200
- Two-thirds of the water used in an average American home is used in the bathroom: 25-40 gallons/5 minute shower, 1.5-7 gallons/toilet flush.
- It takes almost 800 gallons of water to grow the food for one American for one day.
- 100 gallons of water is required to grow one watermelon.
- In industry, it takes over 60,000 gallons to produce one ton of steel, and 39,000 gallons for one car.
- About 500,000 tons/day of pollutants pour into U.S. lakes and rivers, with 11% of them from stormwater runoff.
Contamination issues
The contaminants in water supplies that compromise their quality can be organized into the following classes:
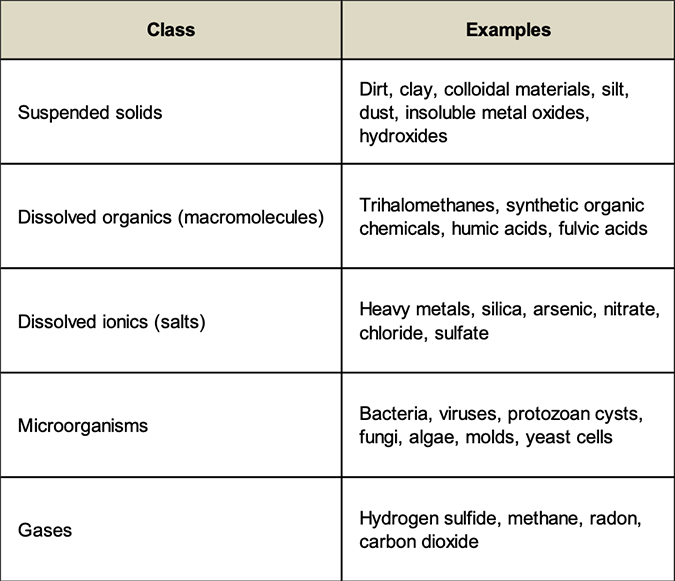
There are not many absolutes in the water treatment industry, but here is one: it is impossible to make water completely free of all contaminants. PCPPs (personal care and pharmaceutical products) and endocrine disruptors have been found in virtually all water supplies worldwide. Undoubtedly, these contaminants have been present for many years, but their concentrations are so low (ppt – parts per trillion), that we have only recently been able to measure them. A ppt is equivalent to one second in 32,000 years, a six inch leap on a journey to the sun, or one pinch of salt in 10,000 tons of potato chips.
Water reuse
Although still in its infancy, water reuse is growing at an estimated 11% per year in the U.S. Most of the recovered water is from municipal wastewater treatment plants (“reclaimed water”) and is used for landscape and agricultural irrigation; however, industrial wastewater reuse is beginning to grow at an even higher rate – over 14% per year, by one estimate.
There are proven technologies available to treat virtually all polluted water supplies; it’s really a matter of committing financial and engineering resources. For almost all wastewater streams, a comprehensive test is required in order to identify the optimum technologies and design the most cost-effective water recovery system.
Due to the extreme variation in the specific kind and concentration of contaminants, industrial wastewater reuse requires significant testing and design expertise; however, with the rapidly increasing shortage of water supplies combined with more stringent, discharge regulations, the incentive to recover and reuse is growing.
As the paradigm of water reclamation takes hold throughout the world, the concept of “direct reuse,” treating wastewater at the source and reusing it directly, will become increasingly common, in municipal, commercial and residential applications (“graywater reuse”). A growing trend is the treatment of municipal wastewater effluent to augment drinking water supplies.
Today, we have an arsenal of treatment technologies available to treat wastewater from virtually any source and produce a supply acceptable for any application.
Crossflow pressure-driven membranes
Arguably, today’s most versatile and economical treatment technology platform includes the four crossflow, pressure-driven technologies of:
- Microfiltration (MF)
- Ultrafiltration (UF)
- Nanofiltration (NF)
- Reverse osmosis (RO)
In these technologies, surface “membrane” filters are utilized, and the bulk solution flows over and parallel to the membrane surface. Because the system is pressurized, purified water is forced through the membrane and becomes “permeate.” The normal turbulent flow of the bulk solution over the surface minimizes the accumulation of particulate matter. This process allows for continuous processing of liquid streams.
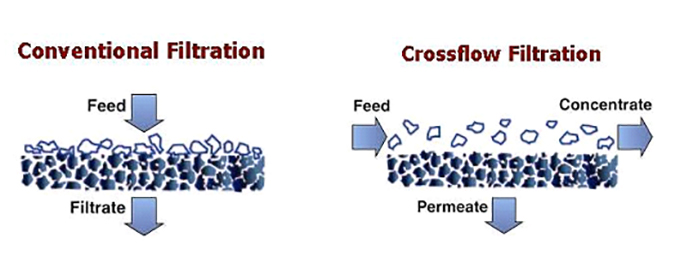
Crossflow membrane filtration offers the following advantages over conventional filtration technologies:
- Continuous operation
- Capable of removing contaminants down into the submicron size range
- Usually requires no chemical addition
- Backwashing capabilities in most designs
- Systems have a very small footprint
It is important to note that with media, cartridge and bag filtration technologies, the filtration process must be frequently halted for backwashing or to replace the medium. Conversely, crossflow filtration is designed to operate continuously, with the concentrate stream carrying away the contaminants. Eventually, these membranes do become fouled and usually require backwashing, cleaning, or some other process to remove foulants.
These technologies are described in detail as follows:
Microfiltration (MF) – Typically used to remove particulate material in the submicron range. Most microfiltration devices in use today are designed as cartridge filters in that the entire solution passes through the filter leaving the particulate material behind, either on the filter surface or down inside the filter medium. The microfiltration devices addressed here use the “crossflow” design, which produces two exiting streams: one which has passed through the membrane medium and is purified (permeate), and the other which flows across and parallel to the media surface, continuously removing the contaminants (concentrate).
Generally, microfiltration involves the removal of particulate, or suspended materials ranging in size from approximately 0.10 to 1.0 microns (100 to 1,000 nm). MF typically operates within a pressure range of 10 to 30 psi (0.68 to 2.0 bar).
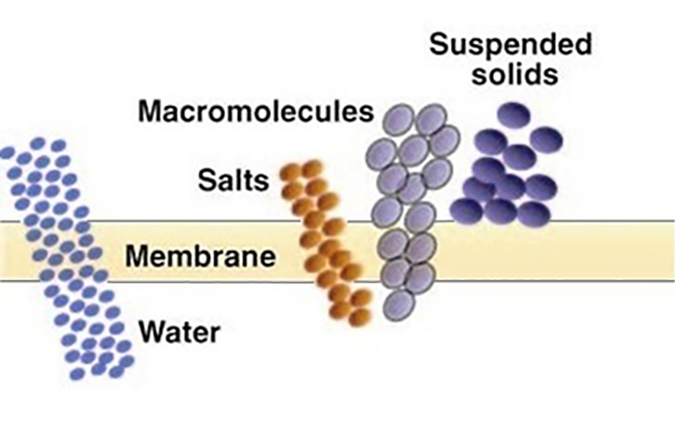
Ultrafiltration (UF) – Used to separate dissolved, non-ionic materials (macro molecules) typically smaller than 0.10 micron (100 nm). The removal characteristics of UF membranes can be described in terms of “molecular weight cutoff” (MWCO), the maximum molecular weight of dissolved compounds that will pass through the membrane pores. MWCO terminology is expressed in Daltons. Basically, ultrafiltration is used to remove dissolved organic contaminants, while suspended solids are removed by microfiltration. UF normally operates in a pressure range of 10 to 100 psi (0.68 to 6.8 bar). UF membranes are available over a wide range of MWCO removal properties, from about 1,000 to over 100,000 Daltons.
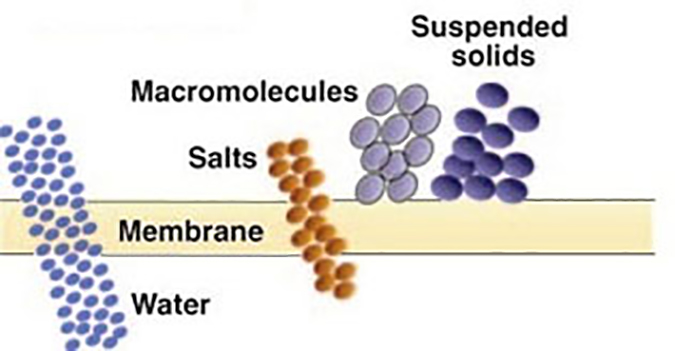
The above processes (MF and UF) separate contaminants based on a “sieving” process; that is, any contaminant too large to pass through the pore is rejected and exits in the concentrate stream.
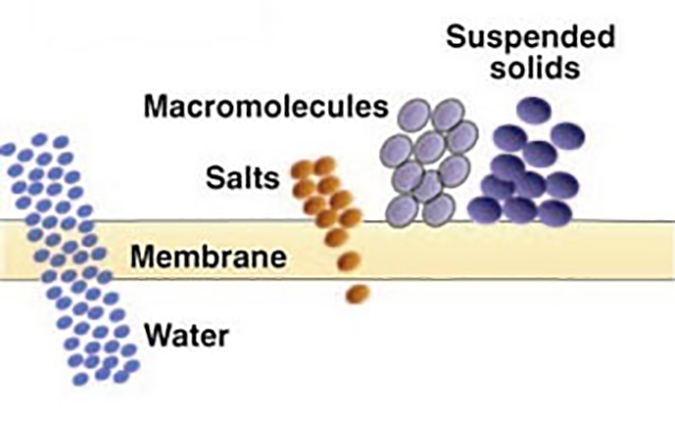
Nanofiltration (NF) – Considered “loose” reverse osmosis. It rejects dissolved ionic contaminants but to a lesser degree than RO. NF membranes reject a higher percentage of multivalent salts than monovalent salts (for example, 99% vs. 20%). These membranes have molecular weight cut-offs for non-ionic solute below 1000 Daltons. NF is illustrated in Figure 5.
Reverse osmosis (RO) – Produces the highest quality permeate of any pressure driven membrane technology. Certain polymers will reject over 99% of all ionic solids, and have molecular weight cut-offs in the range of 50 to 100 Daltons. RO is illustrated in Figure 6.
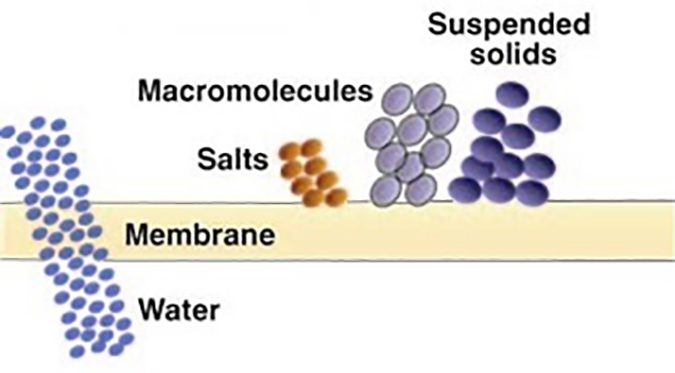
Both NF and RO membranes reject salts utilizing a mechanism that is not fully understood. Some experts believe that whereas the movement of pure water through a membrane is caused by the pressure gradient across the membrane, the passage of ionic materials is based on the concentration gradient across the membrane. It’s a race, and the pure water wins.
With all of these processes, the greater the degree of contaminant removal, the higher the pressure requirement to effect this separation. In other words, reverse osmosis, which separates the widest range of contaminants, requires an operating pressure typically an order of magnitude higher than microfiltration, which removes only suspended solids.
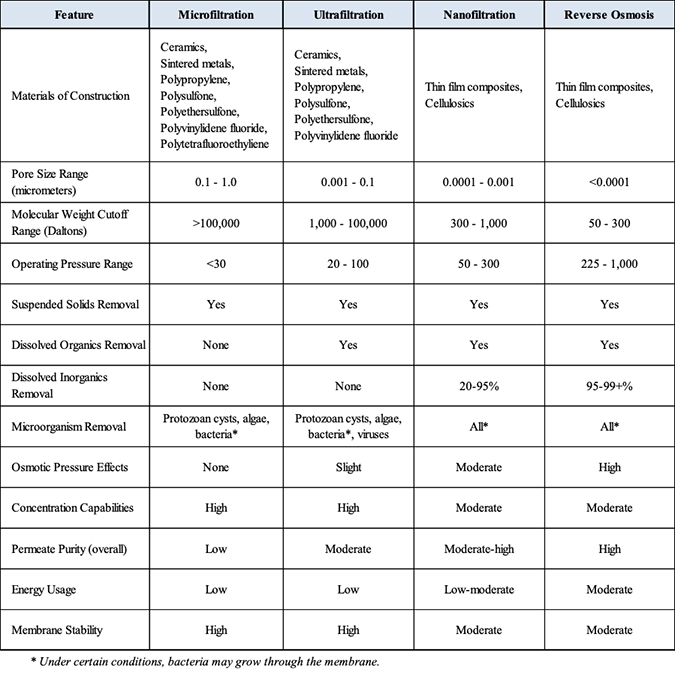
The following table summarizes the various properties and other features of these technologies.
Membrane technologies compared
Now let’s look at some other membrane developments which offer the potential to compete with or supplement the above technologies.
Graphene
Known as a nanoporous atomically thin membrane (NATM), this membrane is a one-atom thick carbon mesh looking something like chicken wire. The hexagonal openings in this structure can be engineered to basically let only water molecules through, while blocking salts and other molecules. It appears that pores in the range of 0.7 to 0.9 nanometers (7-9 angstrom units) are the “sweet spot” size range (a nanometer is one thousandth of a micron).
Theoretically, the flux (permeate) rate of graphene-based membranes is 1000 times higher than polymeric RO membranes, with salts rejection approaching 100%.
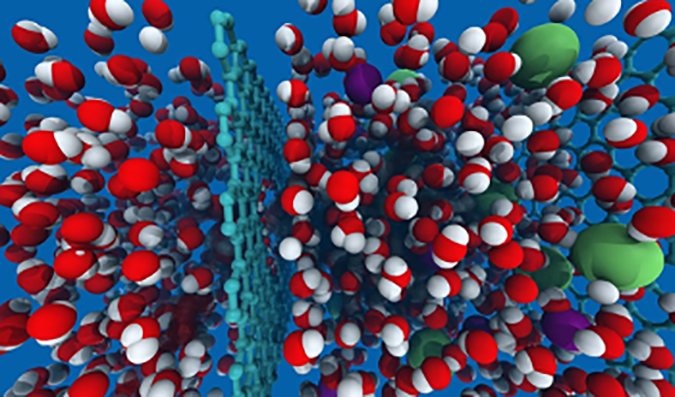
The red and white spheres represent water molecules; the green spheres represent a typical contaminant molecule.
Challenges to the development of this membrane are the ability to create pores of uniform size and distribution over the surface. In addition, the natural hydrophobicity (water-repelling) of carbon atoms and low handling strength need to be addressed.
On the positive side, researchers at MIT and Vanderbilt University have developed a process to manufacture graphene membranes in long rolls.
The graphene is continuously cast onto a roll of copper foil by chemical vapor deposition. A thin layer of polyethersulfone (PES) is then cast onto this surface and interfacially polymerized to form a porous support layer. This layer is stripped off the copper foil, which results in a roll of graphene NATM on a PES backing. Although the PES polymer will slightly reduce membrane flux, it is essential to provide strength and support.
This development appears to offer excellent potential as a new membrane product. Because the manufacturing process is not dissimilar from current polymeric membrane manufacturing, the timeline for commercialization should be shortened. I predict that this new technology could be on the market in 5 to 10 years.
In addition to the research at MIT and Vanderbilt, there is significant activity in graphene technology at a number of other academic institutions including the University of Connecticut, University of Texas, Penn State University, the University of Manchester in the UK, the Masdar Institute in Abu Dhabi, and Monash University in Australia. There are also several companies working on graphene membranes.
Forward osmosis
Having been on the market for at least 10 years, this is not a new technology, but, to date, has not seemed to have reached its full potential
Forward osmosis (FO) uses membranes similar to those used in reverse osmosis, but takes advantage of the natural phenomenon of osmotic pressure. For example, to desalt seawater, a “draw solution” is located on the permeate side of the membrane. This solution has a higher TDS (total dissolved solids) than the seawater, so pure water will leave the seawater and pass through the membrane into the draw solution (normal osmotic flow). The challenge is to then separate the pure water from the draw solution.
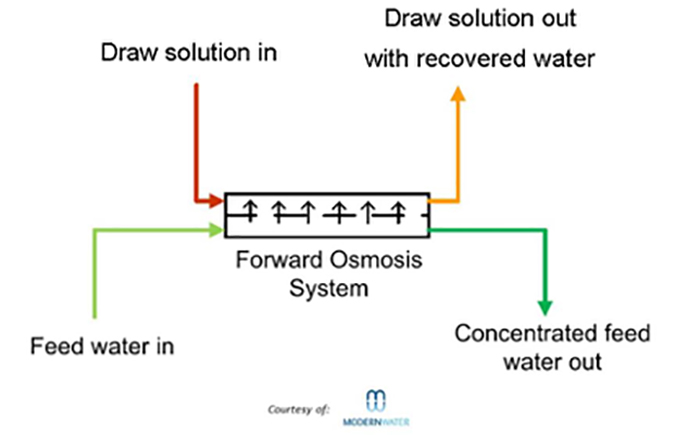
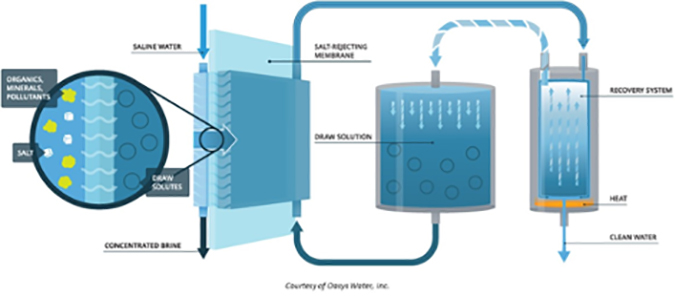
The advantages of forward osmosis over reverse osmosis include:
- No high pressure pumps required
- Uses available membranes (mainly cellulose triacetate)
- Chlorine removal not required
- Generally less fouling
- The draw solution can be reused
The disadvantages are:
- FO has a much lower flux rate
- The purified water must be separated from the draw solution
- Although the draw solution can be tailored to the specific application, it must have a higher TDS than the feed solution, and not contain any contaminants that could contaminate the pure water.
- Of critical importance is the energy required to separate the pure water from the draw solution.
- Somewhere around ten companies have claimed to offer forward osmosis systems; however, several have disappeared, but there are a few new players now. This membrane technology will never, in my opinion, threaten the role of reverse osmosis, but seems to have found a niche in the water treatment industry.
Biomimetic
Biomimetic materials are based on nature or natural materials. Examples are the honeycomb structure of the beehive, spider silk and shark skin. A couple of companies are offering membrane products based on biomimetic materials.
Aquaporin manufactures a membrane with water channels produced by aquaporin proteins introduced into the membrane layer. These channels are said to allow only water to pass while blocking all contaminants, regardless of molecular weight.
Called “the plumbing system for cells,” aquaporins were discovered in 1999, and a Danish company, Aquaporin, was formed in 2005. The company claims greater flux and rejection with their technology. To date, they have commercialized small residential RO membranes and FO membranes. They are currently developing large brackish and seawater membranes.

Another type of biomimetic membrane on the market is known as “DNA Templated Ceramic Nanofiltration Membrane,” manufactured by Cerahelix, Inc., Orono, Maine.
The DNA “self-assembles” in a smooth ceramic layer, producing linear pores, illustrated in Figure 11.
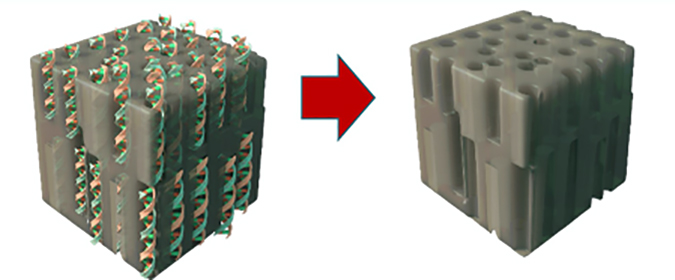
This ceramic layer is applied to ceramic elements to produce inside-out membranes with molecular weight cutoffs (MWCOs) of 400, 800 and 1200 Daltons as illustrated in Figure 12.
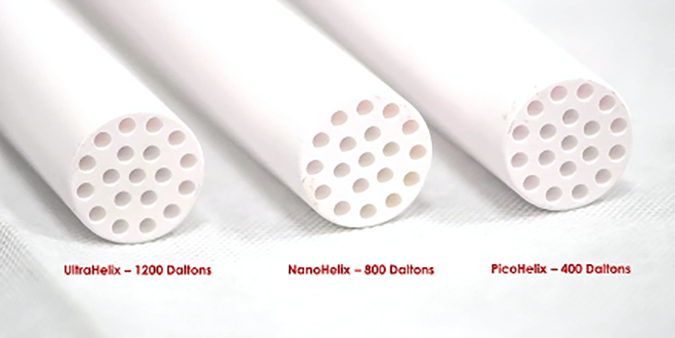
The company claims that their membranes offer all the advantages of ceramics, coupled with lower MWCO and lower fouling properties.
Parting thoughts
These have been just a few examples of the newer membrane developments, some relatively proven and some still in the commercialization stage. Certainly, the “tried and true” crossflow, pressure-driven technologies will also continue to be improved incrementally.
Without a doubt, the growing trend toward wastewater recovery and reuse will spawn new developments and improvements in existing technologies.
Exciting times are ahead!


