
Far-Reaching Implications for Airborne Pathogen Transmission and Climate Adaptation
Particulate matter (PM) is typically classified into three categories: coarse (2.5–10 microns, μm, aka PM10), fine (≤2.5 μm, PM2.5), and ultrafine (≤0.1 microns, PM0.1 UFP). PM2.5 and UFP are of particular concern because they can penetrate deep into the respiratory system, causing well-documented health problems. While these classifications provide a useful framework, real-world particle size distributions are more complex. In particular, PM2.5 is often assumed to consist primarily of 1–2.5 μm particles, especially given the way mass concentration (e.g., μg/m³) is measured and reported. However, studies show that in many cases, including in the indoor environment, particle distributions tend to skew toward much smaller sizes – often 10 to 100 times smaller than expected.
For example, when it comes to airborne pathogen transmission, current infection control policies are based on the premise that most respiratory infections are transmitted by large respiratory droplets, >5 μm, produced by coughing and sneezing, then deposited onto exposed fomite or mucosal surfaces. However, emerging research increasingly indicates that routine respiratory activities – such as speaking, coughing, and even breathing – release a complex spectrum of particle sizes, including a substantial fraction of submicron particles. Notably, a bimodal distribution in the 0.1–0.3 μm range has been observed, with these particles capable of carrying viable viruses and remaining airborne for prolonged periods. Similarly, wildfire smoke – an escalating global concern – is largely composed of particles in the 0.1–0.3 μm range. They can remain suspended in the air for extended durations (days and weeks), travel across continents, and infiltrate indoor environments. High-end particle sizing instruments used to measure particles in schools, offices, and other indoor spaces also reveal a dominance of these superfine particles. Yet, this size range remains largely overlooked – from measurements and removal solutions to health impact. Underestimating or mis-characterizing these pollutants could have detrimental implications for public health and building resilience.
Airborne Pathogen Transmission: Rethinking Bioaerosol Size and Its Impact
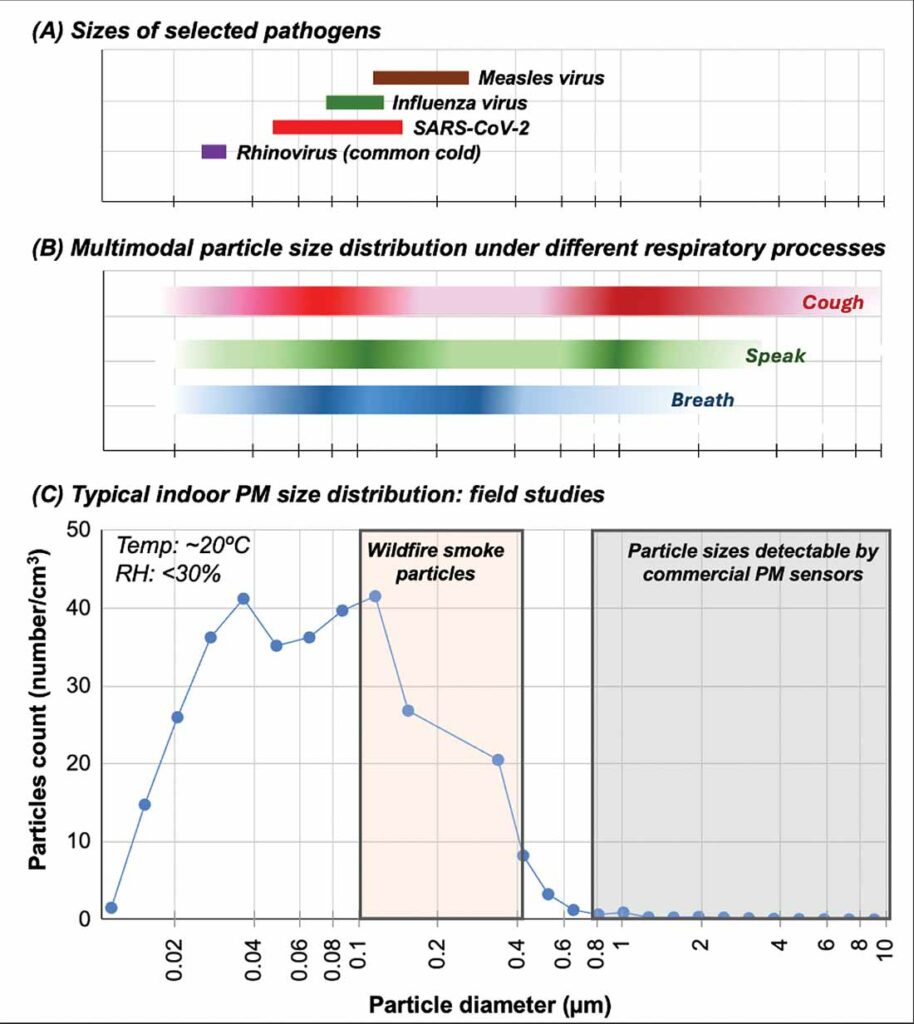
Infectious aerosols are suspensions of pathogens in particles in the air. Figure 1A illustrates the typical size distribution of viruses, highlighting their nanometer-scale dimensions.1 Most recent data show that infectious aerosols from various human respiratory activities co-exist in a wide range of particle sizes that are strikingly consistent across studies, methods, and pathogens (Figure 1B).1,2
There is no strong evidence supporting the notion that most respiratory infections are primarily transmitted through large droplets. In fact, small-particle aerosols are the norm rather than the exception, contrary to what current guidelines suggest.2 Recent studies employing high-resolution, size-resolved measurements – spanning from a few nanometers to tens of microns – have revealed that respiratory particles exhibit multimodal size distributions, with a substantial fraction in the 0.08-0.3 μm (80–300 nm) range (Figure 1B).1 For example, multiple virus types have been identified in exhaled breath aerosols, exhibiting a bimodal particle size distribution with median diameters of approximately 0.1-0.3 μm.
Given knowledge of particle size ranges of relevant indoor pollutants with significant health threats, a key question remains: Are viruses viable in such small aerosols and are they responsible for causing the spread of diseases? Addressing this requires further research, as high-resolution particle size studies have only recently gained attention, and investigations into submicron particle sizes remain limited. However, some studies already suggest this possibility. For instance, one study found that viral aerosol size distributions were typically unimodal within the 0.25–10 μm range, with significant amounts of SARS-CoV-2 RNA detected in sub-0.3 μm particles.3 This raises the possibility that the enveloped SARS-CoV-2 virus could spread through the air without requiring attachment to larger carrier aerosols.
Additionally, researchers detected a notable fraction of COVID-positive samples in <0.25 μm particles. Another finding indicated that resuspension of particles from contaminated surfaces consisting of a range of particle sizes, including those in the <0.3 μm size range, played a significant role in the presence of SARS-CoV-2 RNA of hospital air, highlighting an overlooked transmission route.3
Data on viral particles in the submicron range remain scarce, yet this information with an understanding of particle size distributions is essential, as smaller particles are more likely to reach the alveoli, where deposition efficiency increases as particle size decreases.1,2,4 Their relevance has significant implications for environments beyond healthcare settings where studies typically take place. School students and staff are among some of the most vulnerable and likely spreaders.
Particle Size Distribution in Indoor Spaces: Field Studies
As part of our ongoing research, we conducted air quality measurements in a middle school, sampling air in different classrooms, including science and math classes. We utilized both a Scanning Mobility Particle Sizer (SMPS) and an Optical Particle Sizer (OPS) to obtain and compare high-resolution size distribution data (publication in preparation). Our findings reveal that almost all of the airborne particles were below 0.3 μm, with a median diameter of approximately 0.12 μm (Figure 1C, blue curve). This trend was consistent across different classroom activities (science vs. math) and varying occupancy levels.
Note that seasonality plays a role in particle sizes. In this case, measurements were taken during the winter at relatively low humidity which is known to contribute to the reduced particle sizes. For comparison, we also measured air quality in office settings and on a university campus during different seasons. Across all locations, the results were strikingly similar: the airborne particle population was dominated by submicron particles, primarily below 0.3 μm.
A critical issue identified in our study is the inability of commercial air quality sensors to detect particles in important size ranges. In the school environment, commercial sensors recorded particle counts approximately <5% of the total number of particles as measured by the high-resolution instrument. This difference varies depending on the space measured. The problem is especially significant since most commercial and even industrial PM sensors and detectors rely on laser-scattering, a technique that is simply blind to particles smaller than 0.3 µm – leaving a critical gap in our understanding of air pollution and health risks (gray box in Figure 1C). These findings highlight a major gap in current air quality monitoring, particularly in indoor environments with human occupancy.
IAQ Under Pressure: Climate Adaptation and Resilience for the Built Environment
Numerous studies have demonstrated that respiratory infections spread via a broad range of particle sizes, with a significant portion of pathogen-laden aerosols measuring around or below 0.3 μm. At the same time, wildfires – an escalating global concern and climate adaptation challenge – release vast quantities of fine particulate matter that easily infiltrates buildings. These particles, predominantly in the 0.1–0.3 μm range,5-7 are small enough to bypass many conventional air filtration systems yet remain larger than UFP.
A major challenge in addressing this issue is the triple-blind spot surrounding particles in the 0.3 μm range:
Blind Spot #1:
Measurement limitations: Commercial PM sensors are blind to <0.3 μm particles.
As highlighted in our recent school pilot study, commercial PM sensors fail to detect particles smaller than 0.3 μm. These sensors reported “healthy” air quality, showing little to no change in PM levels under 0.5 and 1 μm, even as human occupancy increased in a classroom. In fact, on a mass concentration basis, PM 0.5, 1.0, and 2.5 were reported consistently as <5 μg/m3, suggesting excellent indoor air quality conditions from a PM perspective. The misleading implications? 1) Existing HVAC operations are perfectly adequate; and, 2) Higher occupancy did not generate more airborne particles, including those capable of carrying viruses.
The translation of particle counts to mass concentrations is also laden with problems, especially in typical commercial PM sensors. Furthermore, because they are so small, particles <0.3 μm barely contribute to overall PM2.5 mass concentration estimates, so even if detectable, they would not move the needle of PM2.5 μg/m3 by much. To better protect human health, however, better measurements and understanding of sub-0.3 μm particles are required.
Blind Spot #2:
Filters are least effective at ~0.3 μm.
The Most Penetrating Particle Size (MPPS) of filters falls in the 0.1–0.3 μm range, where filtration is least effective – exactly where airborne pathogens, wildfire smoke, and other super fine pollutants are concentrated.8 Despite its significance, this size range is largely overlooked by academia, industry, and regulations. While MERV 13+ filters provide some protection against bioaerosols (>50% removal in this range), the vast majority of HVAC systems use MERV 8–10 filters, which can be ineffective. Given the lack of testing requirements and the often steep efficiency drop near MPPS, many buildings remain vulnerable to airborne transmission risks and poor indoor air quality.
Blind Spot #3:
Filter tests don’t account for <0.3 μm organic aerosols.
■ MERV Ratings Start at ≥0.3 μm – Leaving a Critical Gap
MERV ratings, the industry standard for filter performance, do not assess how well filters capture particles below 0.3 μm. Given that wildfire smoke, viral aerosols, and other indoor pollutants often fall within the 0.1–0.3 μm (or smaller) range, the gap in testing raises concerns about real-world filtration efficiency in schools, hospitals, and workplaces.
■ Inorganic Test Particles vs. Real-World Organic Aerosols
Most filter tests rely on inorganic salts (e.g., NaCl, KCl), which are chemically stable, uniform in size, and easy to capture. However, these particles fail to represent the complex, dynamic nature of organic aerosols – such as bioaerosols and wildfire smoke, which is composed of >90% organics and has been shown to degrade filter performance.9 In essence, even the common MERV 13+ filters may be ineffective in protecting against wildfire smoke10 and other relevant indoor air pollutants.
To improve air quality protection, new testing methods are needed that simulate the complexity of airborne pollutants, ensuring filtration technologies are truly effective against the growing air quality challenges we face today.
Conclusions and Future Outlook
While PM2.5 and UFPs (PM0.1) receive growing attention, the 0.1–0.3 μm particle size range remains largely overlooked – both in detection and filtration. They are rarely discussed in research on air quality and health risk assessments, yet they make up a critical component of concerning particles. In turn, their under-recognition and inadequate measurement can compromise health studies, leading to misleading conclusions and ineffective mitigation strategies. These <0.3 μm particles (particularly organic aerosols like wildfire smoke and viral-laden particles) are successfully sneaking past sensors, filters, and the people who study, test, make policies and decisions about building operations that greatly impact health. Meanwhile, the widespread commercial use of PM sensors, coupled with misconceptions about their capabilities and the significance of their measurements, is exacerbating the issue.
Anyone can buy a low-cost sensor today or look at the AirNow map and feel assured of the health of their air from a PM perspective. However, the reality is more complex, even as substantial health risks could still be present. To advance air quality management and health protection, these critical blind spots must be addressed through improved detection technologies, filtration solutions, standards, and regulations that better reflect the complexities of air pollution.
References:
- Pohlker, M.L. et al. Respiratory aerosols and droplets in the transmission of infectious diseases. Rev. Mod. Phys. 2023, 95, 045001. https://doi.org/10.1103/RevModPhys.95.045001
- Fennelly, K. P. Particle sizes of infectious aerosols: implications for infection control.
Lancet Respir Med. 2020, 8, 914-924. - Groma, V. et al. Size distribution and relationship of airborne SARS‑CoV‑2 RNA to indoor aerosol in hospital ward environments. Sci Rep. 2023, 13, 3566.
- Gralton, J.; Tovey, E.; McLaws, M.L.; Rawlinson, W.D. The role of particle size in
aerosolised pathogen transmission: a review. J Infect. 2011, 62,1-13. - James R. Laing, J.R.; Jaffe, D.A.; Hee, J. Physical and optical properties of aged biomass burning aerosol from wildfires in Siberia and the Western USA at the Mt. Bachelor
Observatory. Atmos. Chem. Phys., 2016, 16, 15185–15197. - June, N.A. et al. Aerosol size distribution changes in FIREX-AQ biomass burning plumes:
the impact of plume concentration on coagulation and OA condensation/evaporation. Atmos. Chem. Phys., 2022, 22, 12803–12825. - Joo, T. et al. Aged and obscured wildfire smoke associated with downwind health risks. Environ Sci Technol Lett. 2024, 11, 1340-1347.
- Azimi, P.; Zhao, D.; Stephens, B. Estimates of HVAC filtration efficiency for fine and ultrafine particles of outdoor origin. Atmos. Environ., 2014, 98, 337e346.
- Holder, A.L.; Halliday, H.S.; Virtaranta, L. Impact of do-it-yourself air cleaner design on
the reduction of simulated wildfire smoke in a controlled chamber environment. Indoor Air, 2022, 32, e13163. - Shirman, T.; Shirman, E.; Liu, S. Evaluation of filtration efficiency of various filter media in addressing wildfire smoke in indoor environments: importance of particle size and composition. Atmosphere 2023, 14, 1729.


